使用矢量绘图
Egret中封装了 Graphics 类实现矢量绘图功能,可以绘制矩形、圆形、直线、曲线、圆弧等。下面介绍了矢量绘图功能的基本用法和若干高级用法。
1.绘制矩形
Graphics 类中封装的绘图方法不能直接使用,而需要在显示对象中使用。一些显示对象(如 Shape 和 Sprite )中已经包含了绘图方法,因此可以在显示对象中直接调用这些方法进行绘图。
下面代码以 Shape 对象为例,绘制矩形的:
class GraphicsTest extends egret.DisplayObjectContainer {public constructor() {super();this.addEventListener(egret.Event.ADDED_TO_STAGE, this.onAddToStage, this);}private onAddToStage(event: egret.Event) {const shp: egret.Shape = new egret.Shape();shp.graphics.beginFill(0xff0000, 1);shp.graphics.drawRect(0, 0, 100, 200);shp.graphics.endFill();this.addChild(shp);}}
编译后运行,效果如图:
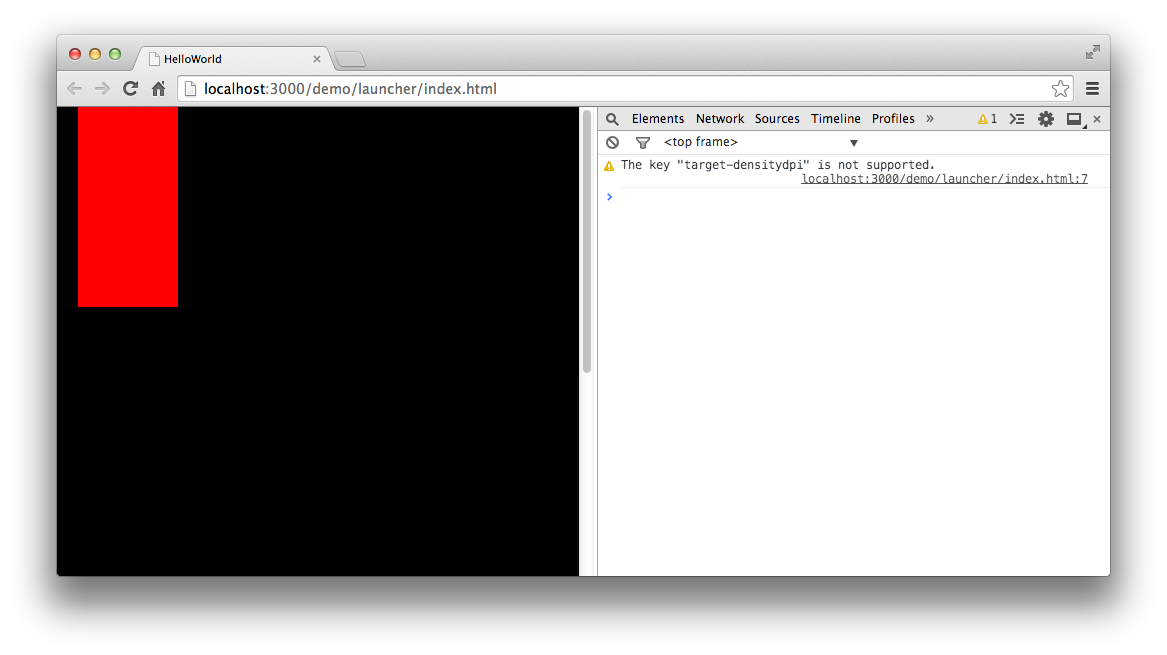
这段代码中核心绘图代码是下面这三行:
shp.graphics.beginFill(0xff0000, 1);shp.graphics.drawRect(0, 0, 100, 200);shp.graphics.endFill();
访问 shp 的 graphics 属性会返回一个 Graphics 对象,操作此对象中的绘图方法即可实现绘图。
调用 beginFill() 方法设置矩形的填充颜色,这里将填充颜色设置为红色(颜色值0xff0000),同时将alpha设置为1,表示完全不透明。
调用 drawRect() 方法设置矩形的位置和大小,前两个参数分别为矩形左上角的X、Y轴坐标(相对于 shp 的锚点计算),后两个参数分别为矩形的宽和高,这里在 (0, 0) 点绘制了一个 100*200 的矩形。
调用 endFill() 方法结束当前绘制操作。
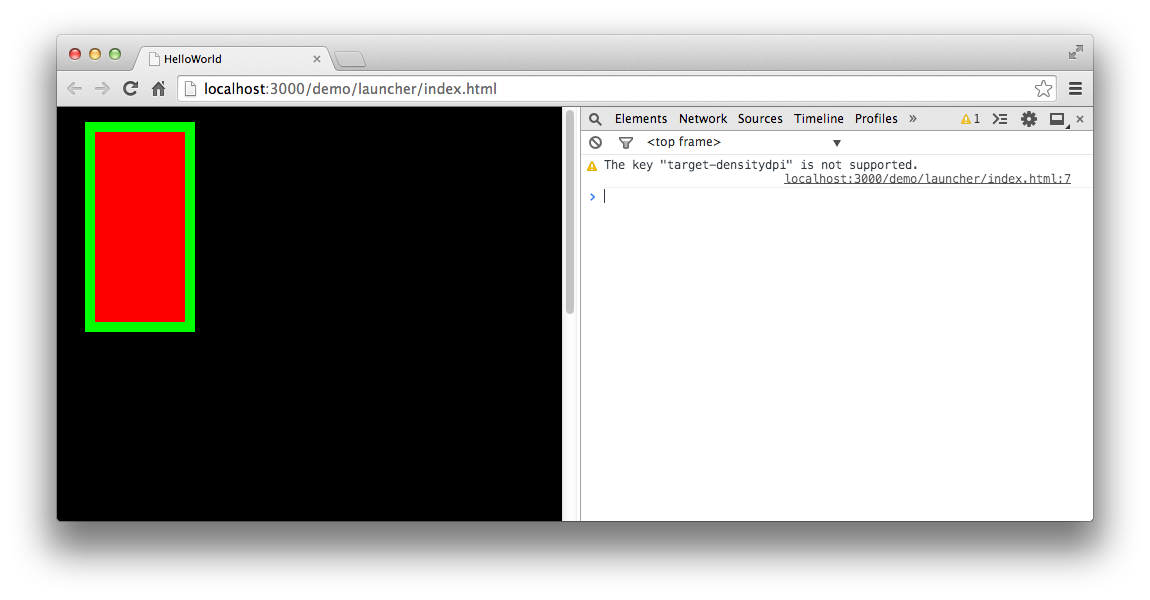
若要为矩形添加描边,需设置线条的样式,通过 lineStyle() 方法实现。
该方法的第一个参数是描边的线条宽度,第二个参数是描边的颜色。
为绘图代码添加一行:
shp.graphics.lineStyle(10, 0x00ff00);
修改后的代码如下:
class GraphicsTest extends egret.DisplayObjectContainer {public constructor() {super();this.addEventListener(egret.Event.ADDED_TO_STAGE, this.onAddToStage, this);}private onAddToStage(event: egret.Event) {const shp: egret.Shape = new egret.Shape();shp.x = 20;shp.y = 20;shp.graphics.lineStyle(10, 0x00ff00);shp.graphics.beginFill(0xff0000, 1);shp.graphics.drawRect(0, 0, 100, 200);shp.graphics.endFill();this.addChild(shp);}}
编译并运行,效果如图:
2.绘制圆形
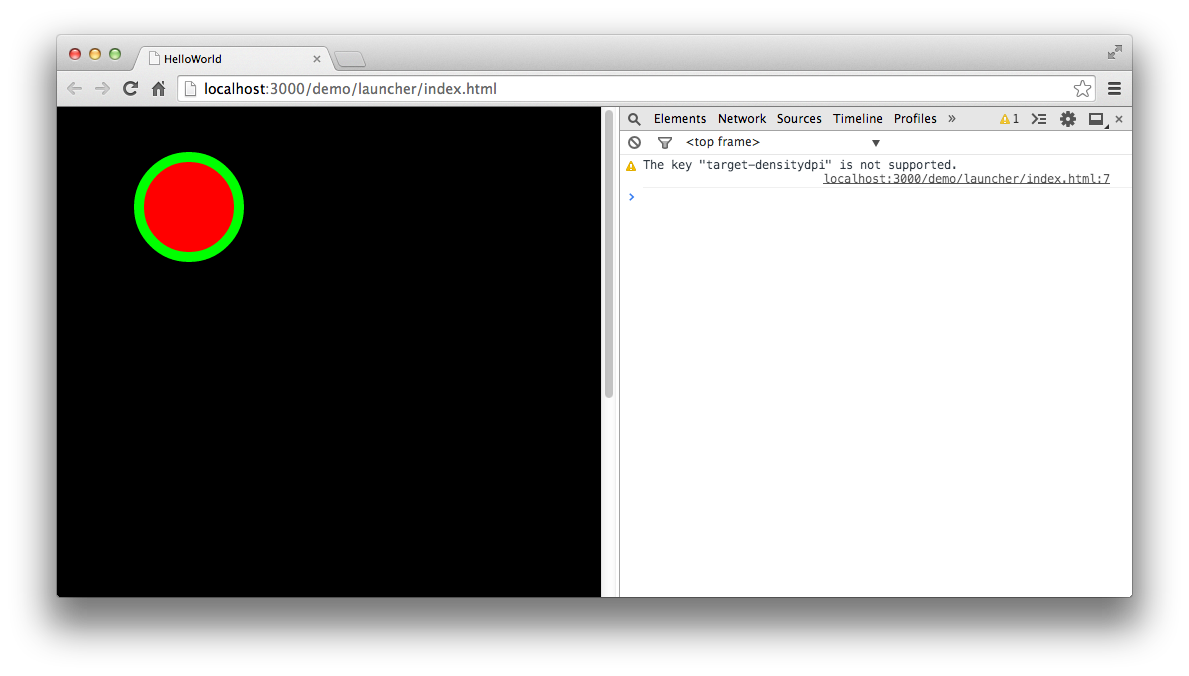
绘制圆形的方法与绘制矩形类似,只需将 drawRect() 方法改为 drawCircle() 方法。
declare class Graphics {drawCircle(x: number, y: number, radius: number): void;}
drawCircle() 方法接受三个参数,第一个参数为圆心的X轴坐标,第二个参数为圆心的Y轴坐标,第三个参数为半径。
注意:圆心的X轴和Y轴位置是相对于
Shape对象的锚点计算的.
下面代码示例绘制了一个半径为50像素的圆形:
class GraphicsTest extends egret.DisplayObjectContainer {public constructor() {super();this.addEventListener(egret.Event.ADDED_TO_STAGE, this.onAddToStage, this);}private onAddToStage(event: egret.Event) {const shp: egret.Shape = new egret.Shape();shp.x = 100;shp.y = 100;shp.graphics.lineStyle(10, 0x00ff00);shp.graphics.beginFill(0xff0000, 1);shp.graphics.drawCircle(0, 0, 50);shp.graphics.endFill();this.addChild(shp);}}
编译并运行,效果如图:
3.绘制直线
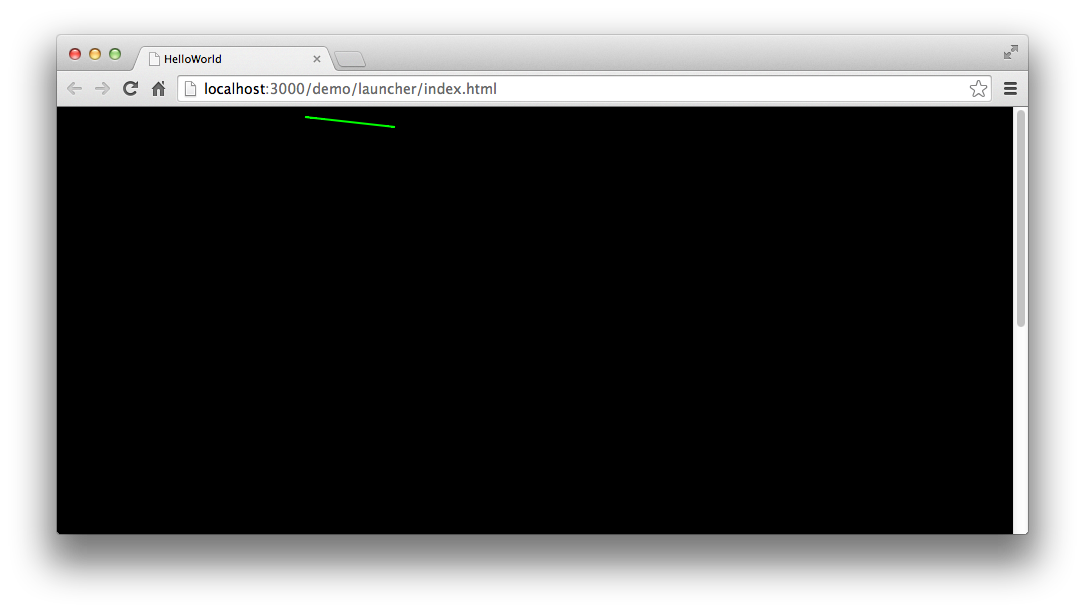
使用Graphics绘制直线需要使用两个方法: moveTo() 和 lineTo(),它们输入参数是一对坐标值。moveTo() 负责绘制直线的起始点,lineTo() 负责绘制直线的终点。
declare class Graphics {moveTo(x: number, y: number): void;lineTo(x: number, y: number): void;}
在绘图直线前,需要先制定线条的样式,设置 lineStyle() 方法:
shp.graphics.lineStyle(2, 0x00ff00);
然后使用 moveTo() 来设定线条的起始点,使用 lineTo() 来设定线条的终点。完整代码如下:
class GraphicsTest extends egret.DisplayObjectContainer {public constructor() {super();this.addEventListener(egret.Event.ADDED_TO_STAGE, this.onAddToStage, this);}private onAddToStage(event: egret.Event) {const shp: egret.Shape = new egret.Shape();shp.graphics.lineStyle(2, 0x00ff00);shp.graphics.moveTo(10, 10);shp.graphics.lineTo(100, 20);shp.graphics.endFill();this.addChild(shp);}}
编译后运行,效果如下图:
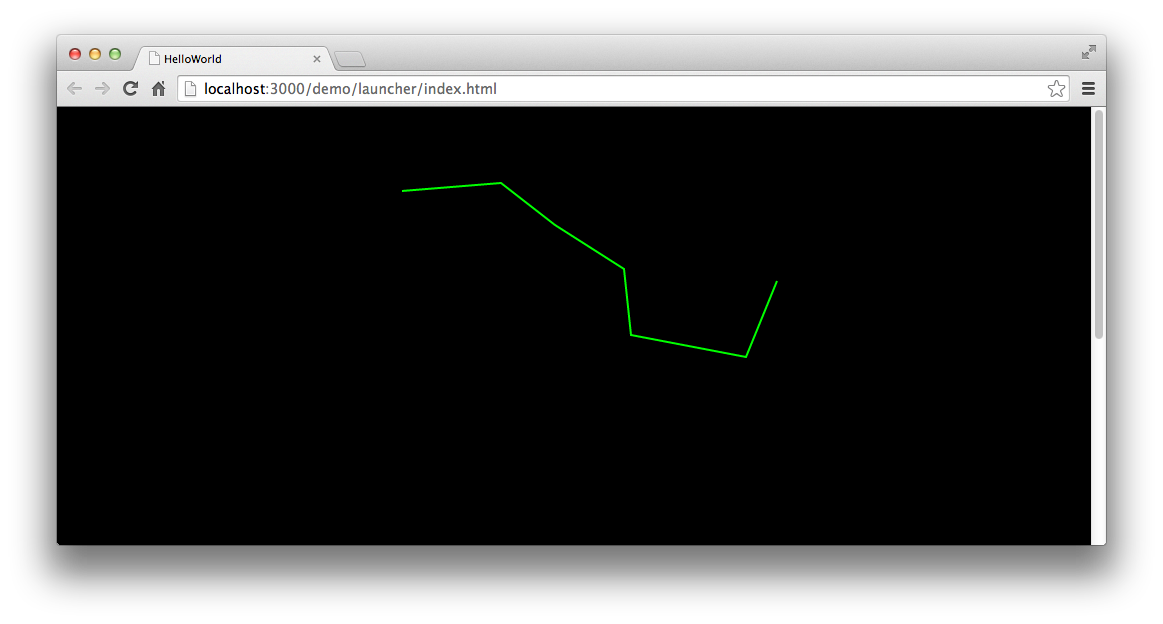
也可以连续绘制多条首尾相接的直线,形成一条折线,代码如下:
const shp: egret.Shape = new egret.Shape();shp.graphics.lineStyle(2, 0x00ff00);shp.graphics.moveTo(68, 84);shp.graphics.lineTo(167, 76);shp.graphics.lineTo(221, 118);shp.graphics.lineTo(290, 162);shp.graphics.lineTo(297, 228);shp.graphics.lineTo(412, 250);shp.graphics.lineTo(443, 174);shp.graphics.endFill();this.addChild(shp);
绘制折线时,无需多次使用
moveTo()方法,连续使用lineTo()方法即可。
编译后运行,效果如图:
4.绘制曲线
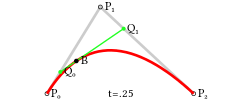
Egret中提供的曲线绘制是“二次贝塞尔曲线”,下图是“二次贝塞尔曲线”的结构图,其中P0是起始点,P1是控制点,P2是终点。
绘制曲线时,需使用 Graphics 中的 curveTo() 方法。
declare class Graphics {curveTo(x1: number, y1: number, x2: number, y2: number): void;}
curveTo() 方法需设置4个参数,前两个参数是控制点(P1)的位置,后两个参数是终点(P2)的位置。
执行绘图时,先使用 moveTo() 方法指定曲线的起始点,然后使用 curveTo() 指定曲线的控制点和终点。在程序进行绘图时,绘制过程如下图:
示例代码:
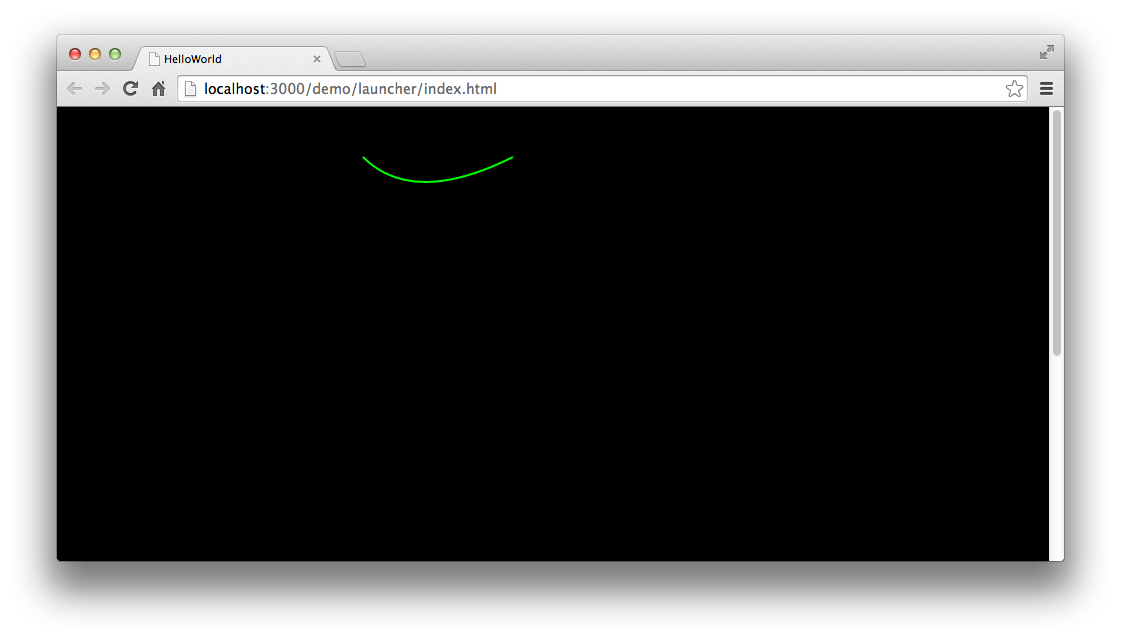
class GraphicsTest extends egret.DisplayObjectContainer {public constructor() {super();this.addEventListener(egret.Event.ADDED_TO_STAGE, this.onAddToStage, this);}private onAddToStage(event: egret.Event) {const shp: egret.Shape = new egret.Shape();shp.graphics.lineStyle(2, 0x00ff00);shp.graphics.moveTo(50, 50);shp.graphics.curveTo(100, 100, 200, 50);shp.graphics.endFill();this.addChild(shp);}}
编译后运行,效果如图:
5.绘制圆弧
绘制封闭圆弧使用 Graphics 中的 drawArc() 方法。
declare class Graphics {drawArc(x: number, y: number, radius: number, startAngle: number, endAngle: number, anticlockwise: boolean): void;}
前两个参数是圆弧路径的圆心位置,radius 是圆弧半径。startAngle 是圆弧起点的角度,从x 轴方向开始计算,以弧度为单位,endAngle 是圆弧终点的角度,anticlockwise 控制绘制方向,如果为 true,逆时针绘制圆弧,反之,顺时针绘制。
下面的例子绘制了一个从 0 到 π 的圆弧:
class GraphicsTest extends egret.DisplayObjectContainer {public constructor() {super();this.addEventListener(egret.Event.ADDED_TO_STAGE, this.onAddToStage, this);}private onAddToStage(event: egret.Event) {const shp: egret.Shape = new egret.Shape();shp.graphics.beginFill(0x1122cc);shp.graphics.drawArc(200, 200, 100, 0, Math.PI, true);shp.graphics.endFill();this.addChild(shp);}}
编译并运行,效果如图:
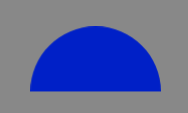
其中 endAngle 使用 Math.PI 表示弧度 π ,可以在数学相关API里查询到。
6.绘制圆弧高级使用
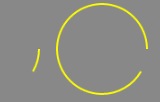
6.1.画弧
const shape: egret.Shape = new egret.Shape();shape.graphics.lineStyle(2, 0xffff00);shape.graphics.drawArc(50, 50, 50, 0, Math.PI / 180 * 30, false);shape.graphics.endFill();
6.2.画拱形
const shape: egret.Shape = new egret.Shape();shape.graphics.beginFill(0xff0000);shape.graphics.drawArc(50, 50, 50, 0, Math.PI / 180 * 60, false);shape.graphics.endFill();
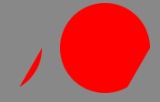
画拱和画弧的区别就是:画拱需要填充图形,画弧不需要填充图形。
6.3.画扇形
扇形其实就是圆心跟弧的2个端点连接后的一个封闭区域。
const r: number = 50;const shape: egret.Shape = new egret.Shape();shape.graphics.beginFill(0xff0000);shape.graphics.moveTo(r, r); //绘制点移动(r, r)点shape.graphics.lineTo(r * 2, r); //画线到弧的起始点shape.graphics.drawArc(50, 50, 50, 0, 260 * Math.PI / 180, false); //从起始点顺时针画弧到终点shape.graphics.lineTo(r, r); //从终点画线到圆形。到此扇形的封闭区域形成shape.graphics.endFill();
6.4.画弧形进度条
class GraphicsText {private getArcProgress(): egret.Shape {const shape: egret.Shape = new egret.Shape();let angle: number = 0;egret.startTick(function (timeStamp: number) {angle += 1;changeGraphics(angle);angle = angle % 360;return true;}, this);function changeGraphics(angle) {shape.graphics.clear();shape.graphics.lineStyle(2, 0x0000ff, 1);shape.graphics.drawArc(50, 50, 50, 0, angle * Math.PI / 180, false);shape.graphics.endFill();}}}
关于代码中 egret.startTick 的用法,可参考Timer计时器
6.5.画扇形进度条
class GraphicsText {private getSectorProgress(): egret.Shape {const shape: egret.Shape = new egret.Shape();let angle: number = 0;egret.startTick(function (timeStamp: number): boolean {angle += 1;changeGraphics(angle);angle = angle % 360;return true;}, this);return shape;function changeGraphics(angle) {shape.graphics.clear();shape.graphics.beginFill(0xff0000);shape.graphics.moveTo(50, 50);shape.graphics.lineTo(100, 50);shape.graphics.drawArc(50, 50, 50, 0, angle * Math.PI / 180, false);shape.graphics.lineTo(50, 50);shape.graphics.endFill();}}}
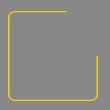
6.6.画不规则边框进度条
下面是一个示例,通过结合遮罩 (mask) 和扇形进度条来模拟边框的进度显示。关于 mask 的具体用法,可参考遮罩
- 首先,提供一个只有边框的全封闭的图形。比如

使用上面介绍的扇形进度条,并确保扇形确定的圆的区域可以完整覆盖边框图。要将扇形的圆心对准边框中心。
将边框的
mask设置成扇形进度条,至此一个简单的边框进度条已完成。可以通过修改被遮罩图形,来做成适合项目的进度条,比如图形不是一个边框,而是一个灰色框的填充图。

- 代码:
class GraphicsText {private getSectorProgress(): egret.DisplayObjectContainer {const container: egret.DisplayObjectContainer = new egret.DisplayObjectContainer();const w: number = 100;const h: number = 100;const r: number = Math.max(w, h) / 2 * 1.5;const bitmap = new egret.Bitmap(RES.getRes(key));container.addChild(bitmap);bitmap.width = w;bitmap.height = h;const shape: egret.Shape = new egret.Shape();shape.x = bitmap.width / 2;shape.y = bitmap.height / 2;bitmap.mask = shape;container.addChild(shape);let angle = 0;egret.startTick(function (timeStamp: number): boolean {angle += 1;changeGraphics(angle);angle = angle % 360;return true;}, this);return container;function changeGraphics(angle) {shape.graphics.clear();shape.graphics.beginFill(0x00ffff, 1);shape.graphics.lineTo(r, 0);shape.graphics.drawArc(0, 0, r, 0, angle * Math.PI / 180, true);shape.graphics.lineTo(0, 0);shape.graphics.endFill();}}}
- 效果图
mask很消耗 cpu,建议少用不停修改mask的方式做动画。
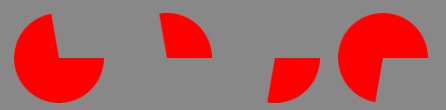
7.多个形状的绘制
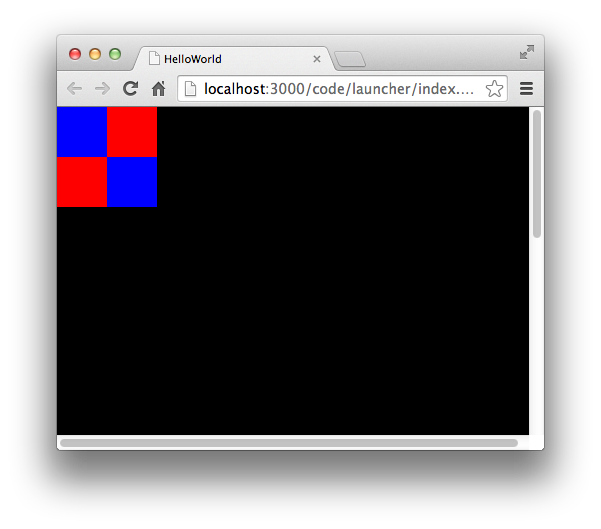
以下代码在一个 Shape 对象中绘制4个小格子,互相紧邻,并且红蓝相间。
this.graphics.beginFill(0x0000ff);this.graphics.drawRect(0, 0, 50, 50);this.graphics.endFill();this.graphics.beginFill(0x0000ff);this.graphics.drawRect(50, 50, 50, 50);this.graphics.endFill();this.graphics.beginFill(0xff0000);this.graphics.drawRect(50, 0, 50, 50);this.graphics.endFill();this.graphics.beginFill(0xff0000);this.graphics.drawRect(0, 50, 50, 50);this.graphics.endFill();
将该 Shape 对象放到显示列表,编译运行,得到如图效果:
注意:多个形状绘制,互相是独立的,每一次绘制填充,都必须以
endFill()结束,才能开始下一次绘制。
8.清空绘图
清空绘图操作是将已经绘制的图像全部清空,可以执行 Graphics 中的 clear() 方法,代码如下:
shp.graphics.clear();